Clustering in R and Python
29 Feb 2016Clustering is a kind of unsupervised machine learning method which does not need any predefined labels to describe the entities. The clustering algorithms can classify the observations to several groups by operating on the relevant features to minimize the variations within groups.
K-means clustering
Set up the number of clusters (K) firstly, assign the observation to its nearest centroid, calculate the new centroids and assign the observations again and again until these is no change of the centroid or the defined number of iterations is reached.
R
1
2
3
4
5
6
7
8
9
10
11
12
13
14
15
16
17
18
19
20
21
22
23
24
25
26
27
# Load data set
data(iris)
# Training (70%) and test (30%) data set
set.seed(1234)
size <- nrow(iris)
trainIndex <- sample(1:size, 0.7*size)
trainD <- iris[trainIndex,]
testD <- iris[-trainIndex,]
# K-means clustering
km <- kmeans(trainD[,1:4],
centers=3, # number of clusters
nstart=25 # number of random sets
)
# Predict on test data
library(clue)
testPred <- cl_predict(km,testD[,1:4]) # predict the class ids
# Performance
table(testD[,5],testPred)
## testPred
## 1 2 3
## setosa 0 0 11
## versicolor 1 20 0
## virginica 10 3 0
You can try many times to choose a proper K value to minimize the total within-cluster sum of squares.
Python 2.7
1
2
3
4
5
6
7
8
9
10
11
12
13
14
15
16
17
18
19
20
21
22
23
24
25
26
27
28
29
30
31
32
33
# Load data
from sklearn import datasets
iris = datasets.load_iris()
label = iris.target
data = iris.data
# Create training and test data set
import random
random.seed(1234)
size = data.shape[0]
trainIndex = random.sample(range(0,size),int(0.7*size))
testIndex = list(set(range(0,size))-set(trainIndex))
trainD = data[trainIndex]
testD = data[testIndex]
testL = label[testIndex]
# K-means clustering
from sklearn.cluster import KMeans
km = KMeans(n_clusters=3).fit(trainD)
# Predict the cluster
testPred = km.predict(testD)
# Performance
import pandas as pd
pd.crosstab(testL,testPred,rownames=['Actual species'],
colnames=['Predict cluster'])
## Predict cluster 0 1 2
## Actual species
## 0 0 0 14
## 1 11 1 0
## 2 7 12 0
Hierarchical clustering
As its name implies, each observation is assigned to single cluster first and then combine the two most similar clusters iteratively until there is just a single cluster. For the assignments of the observations are based on dissimilarities matrix, the classified groups will be influenced by the method of measuring the similarity used.
R
1
2
3
4
5
6
7
8
9
10
11
12
13
14
15
16
17
18
19
20
21
22
23
24
25
26
27
28
29
30
31
32
33
# Follow the last section of the R code
# Hierarchical clustering algorithm uses the dissimilarity
# structure of the training data set, and it will be hard to
# connect the distance matrices between training data
# and test data. And this algorithm just combines
# the similar observations or clusters iteratively that
# makes the clusters will be highly influenced
# by the data set used. So we can not predict
# the clusters on new data set. And I use whole data
# set for clustering here.
# Compute distance matrix
dis <- dist(iris[,1:4],
method = "euclidean" # distance measure
)
# Hierarchical clustering
hc <- hclust(dis,
method = "ward.D" # agglomeration method
)
# Plot cluster dendrogram (Fig. 1)
plot(hc,xlab='',sub='',labels=F)
abline(h=30,col='red') # I know there are three species
# Performance. Try different distance measure
# or agglomeration method to improve it
table(iris[,5],cutree(hc,h=40))
## 1 2 3
## setosa 50 0 0
## versicolor 0 50 0
## virginica 0 14 36
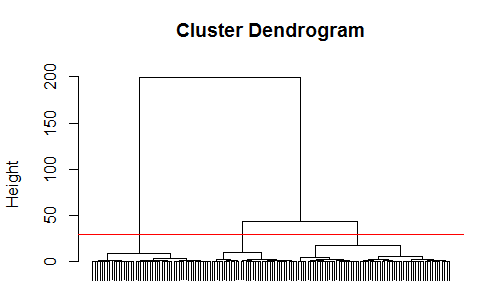 Figure 1 Cluster dendrogram.
Python 2.7
1
2
3
4
5
6
7
8
9
10
11
12
13
14
# Hierarchical clustering
from sklearn.cluster import AgglomerativeClustering
hc = AgglomerativeClustering(n_clusters=3,linkage='ward')
hcPre = hc.fit_predict(data)
# Performance
pd.crosstab(label,hcPre,rownames=['Actual species'],
colnames=['Predict cluster'])
## Predict cluster 0 1 2
## Actual species
## 0 0 50 0
## 1 49 0 1
## 2 15 0 35